
Aggregate
Public reference datasets are queried and reconciled around a single building, with no technical input required.
 Discuss your project
Energy, climate and buildings · Live project
Geominnov aggregates public building data — energy ratings, land registry, urban planning, natural and climate risks — to produce an energy diagnosis, prioritised works and territory-wide oversight.
Energy ratings, land registry, urban planning, natural disasters, solar potential: it's all public, but scattered across technical portals that no one opens before buying or renovating.
The result: works decided on intuition, risks discovered too late, and local authorities with no fine-grained view of their housing stock.
Public reference datasets are queried and reconciled around a single building, with no technical input required.
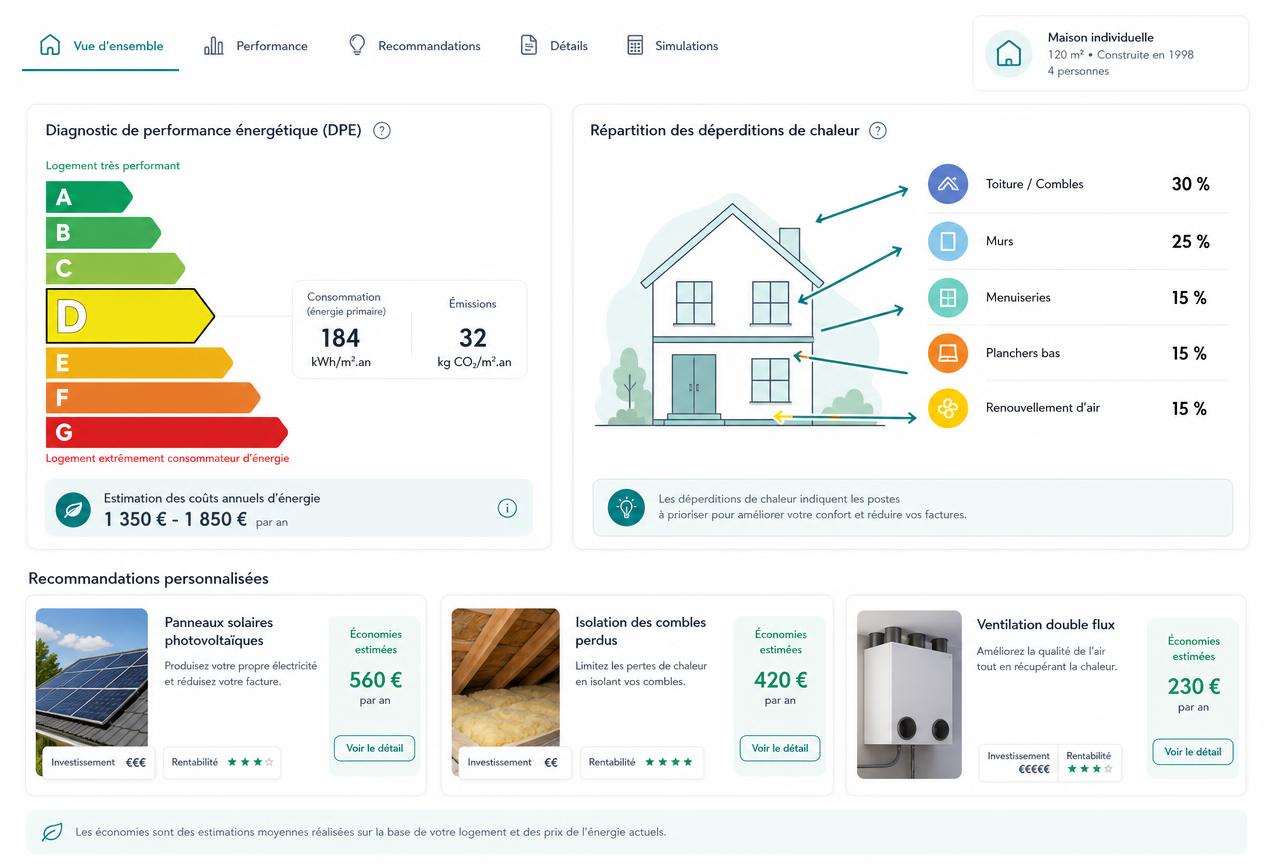
Energy performance, heat loss, natural risks and climate projections are brought together into readable scores.
Prioritised works, estimated savings, available grants and compared scenarios at the scale of a housing stock.
Address, property type, year built, equipment: the form guides the owner and produces a complete energy assessment.
Official ADEME energy ratings, land registry, urban planning, solar potential, fibre eligibility: reference datasets are queried and reconciled automatically.
Interactive maps of natural disasters, history, timeline and statistics by municipality, up to a global scale.
Flooding, heatwaves, drought, hail, seismic zones, polluted sites, natural-risk and flood-risk plans synthesised into a single readable score.
The property is projected against upcoming climate scenarios, to help decide on works based on future risk.
Prioritised works, estimated savings, profitability and a project simulation with associated grants and financing.
Building modelling, cross-section view, heat loss and an immersive VR view to make the diagnosis obvious.
Explore the building stock through street-level panoramas, target a building and overlay its data.
Directory and dedicated space for tradespeople: sign-up, detailed profile, matching with renovation projects.
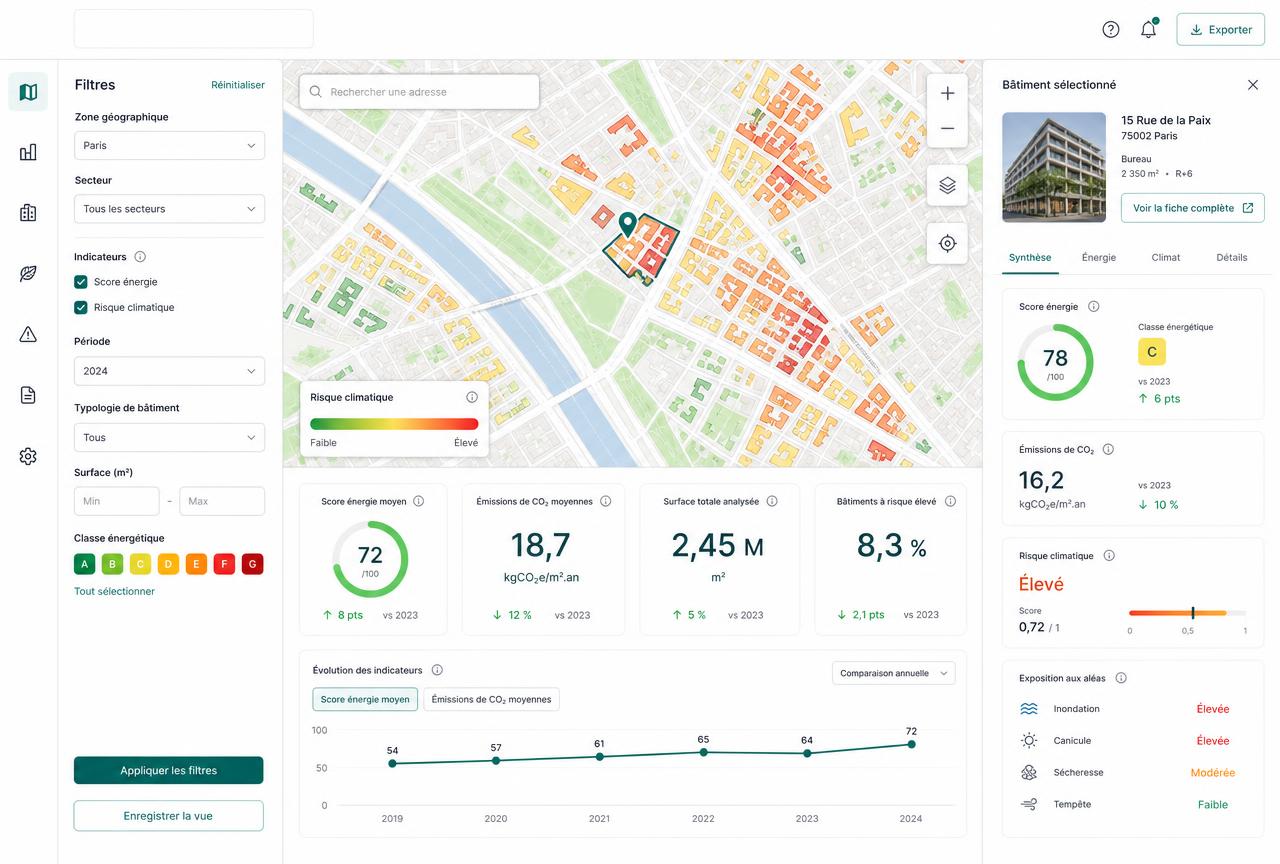
For local authorities: housing stock analysed, filters, compared renovation scenarios, quantified impact and collective reports.
The product wasn't built around datasets, but around the moments when a decision gets made: buying, renovating, arbitrating a public budget.
Every screen answers a precise question and ends with a possible action, not a raw table.
Homeowner
Rather than an isolated quote, the homeowner gets a ranked list of works with estimated savings and return on investment.
Property purchase
Real energy rating, natural risks, climate projections and energy costs are gathered before signing.
Local authority
The local authority identifies vulnerable homes, simulates scenarios and measures energy and carbon impact.
Professional
Tradespeople access already-diagnosed requests, complete with the building's technical context.
They assess their home, understand its heat loss and track their renovation plan in their history.
They use a territory dashboard, collective reports and compared scenarios across their housing stock.
They publish their profile, receive contextualised requests and work on already-scoped projects.
The challenge isn't displaying public data, but making it understandable: maps, scores, 3D and thermal visualisations were designed to be read without technical expertise.
Delivered in short cycles, datasets added one by one, and validated with the homeowners, tradespeople and local authorities who use it.
Go further
Let's talk about your sources, your users and the decisions your product needs to make obvious.